HATPRO#
Instrumentation#
Profiling radiometers like our HATPRO-G5 are mainly used to derive vertical profiles of atmospheric temperature and humidity. The infrared radiometer extension allows to cloud base height and ice cloud detection. The radiometer covers high-resolution temperature profiling of the boundary layer and low-humidity applications. All models of the series provide accurate total amounts of atmospheric water vapor and cloud liquid water. The retrieval algorithms is custom designed and based on the long-term dataset of radiosondes at the GAIA-Airport. Two bands, 22-31 GHz (7-channel filter-bank humidity profiler and LWP radiometer) and 51-58 GHz (7-channel filter-bank temperature profiler) are used in this radiometer.
Retrieved data types:
vertical profiles of atmospheric temperature
vertical profile of atmospheric humidity (relative and absolute humidity)
Liquid Water Path (LWP)
Integrated Water Vapor (IWV)
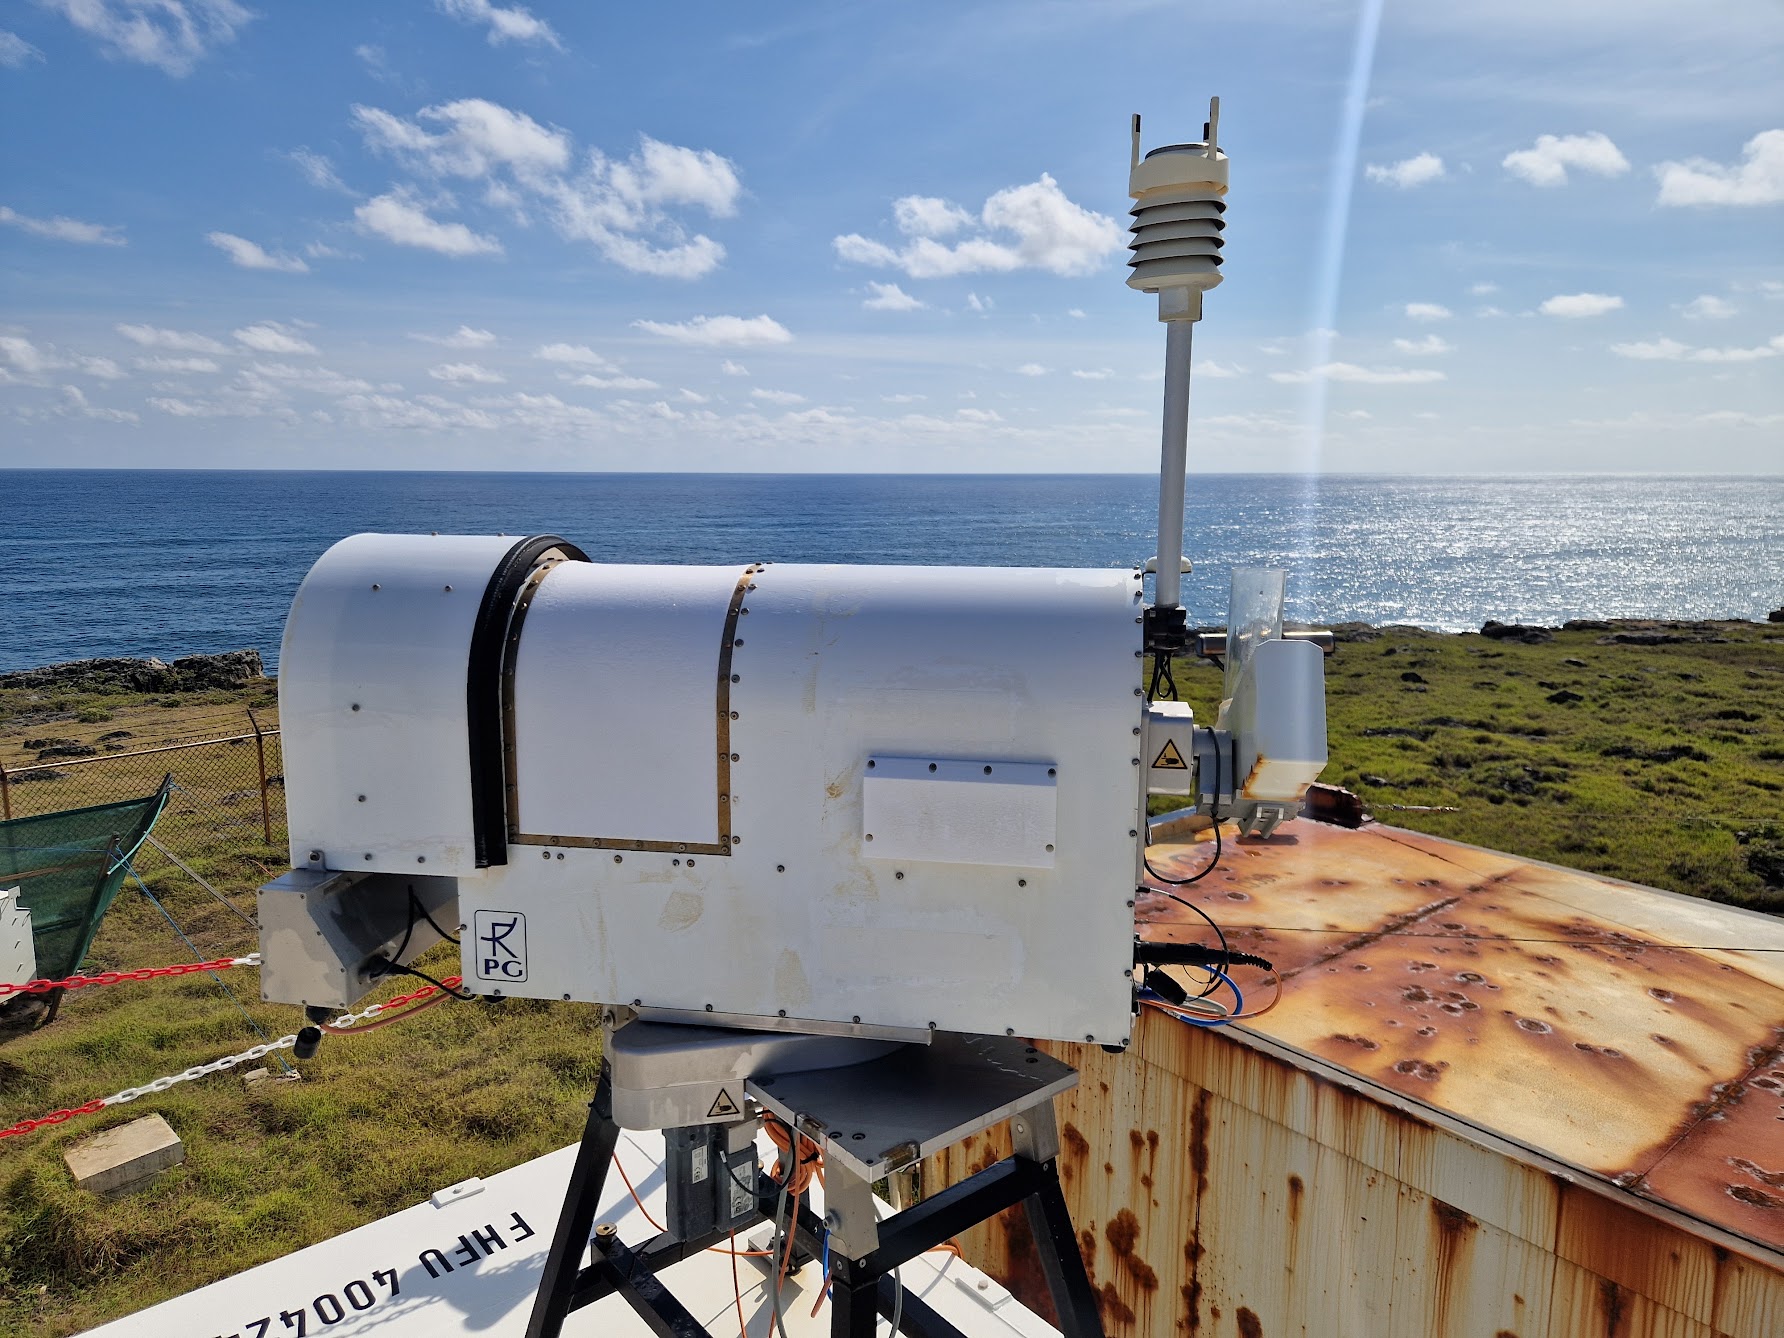
Since 2011 to 2017 we installed a Hatpro (SUNHAT) from University Cologne at our site. In 2017 we installed the first HATPRO-G5 (BCOHAT1) at the site.
Data Availability#
The data is available as .zarr files in the catalog as:
BCO.HATPRO_BRTper-channel brightness temperaturesBCO.HATPRO_HKDhousekeeping dataBCO.HATPRO_IWVintegrated water vapor retrieval
Raw data
The HATPRO datasets are not suitable for direct scientific use. They include raw data from, e.g., various scanning modes and have not been subject to further quality checks.
Sample Plot#
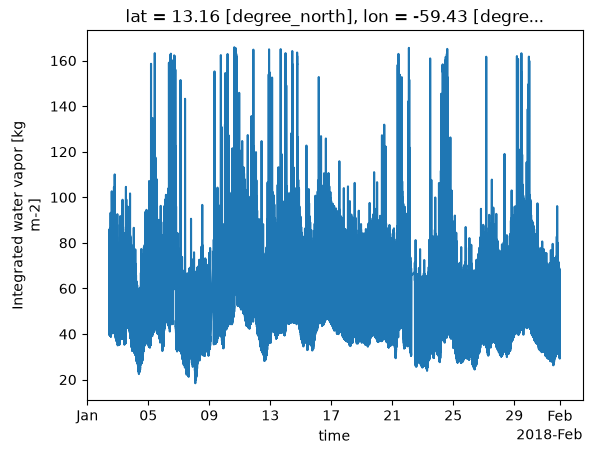
Plot integrated water vapor (IWV) retrieval
import intake
cat = intake.open_catalog("https://tcodata.mpimet.mpg.de/catalog.yaml")
ds = cat.BCO.HATPRO_IWV.to_dask()
ds.sel(time="2018-01").IWV.plot(x="time")
/builds/tco/bco/docs/.venv/lib/python3.14/site-packages/intake_xarray/base.py:21: FutureWarning: The return type of `Dataset.dims` will be changed to return a set of dimension names in future, in order to be more consistent with `DataArray.dims`. To access a mapping from dimension names to lengths, please use `Dataset.sizes`.
  'dims': dict(self._ds.dims),
[<matplotlib.lines.Line2D at 0x7f2ea0533620>]
The full dataset:
ds
<xarray.Dataset> Size: 3GB
Dimensions:     (time: 145190620)
Coordinates:
  * time        (time) datetime64[ns] 1GB 2017-10-01T00:04:17 ... 2026-10-19T...
    lat         float64 8B ...
    lon         float64 8B ...
    sensor_alt  float64 8B ...
Data variables:
    AZI         (time) float32 581MB dask.array<chunksize=(4194304,), meta=np.ndarray>
    ELE         (time) float32 581MB dask.array<chunksize=(4194304,), meta=np.ndarray>
    IWV         (time) float32 581MB dask.array<chunksize=(4194304,), meta=np.ndarray>
    RF          (time) int8 145MB dask.array<chunksize=(4194304,), meta=np.ndarray>
    SF          (time) int8 145MB dask.array<chunksize=(4194304,), meta=np.ndarray>
Attributes:
    Conventions:           CF-1.12
    _logical_cutoff_date:  2026-10-20T00:00:00Z
    bcoproc_version:       0.0.0.post2014.dev0+67c3872
    featureType:           timeSeries
    institution:           Max Planck Institute for Meteorology, Hamburg
    license:               CC0-1.0
    location:              The Barbados Cloud Observatory (BCO), Deebles Poin...
    platform:              BCO
    source:                HATPRO microwave radiometer
    summary:               This dataset contains measurements of the microwav...
    title:                 Microwave radiometer (HATPRO) data from BCO (Level 1)
    tool_versions:         {"Python": "3.11.2 (main, Apr 28 2025, 14:11:48) [...