EMBRAPA#
Instrumentation: Micro Rain Radar#
The suite of micro-rain radar measurements available to the TCO group includes an MRR operated during the aerosols, clouds, convection experiment (ACONVEX) project near Manaus, Brasil.
The Manaus-Embrapa site is located at \(2.89^{\circ} \mathrm{S}, \, 59.96^{\circ} \mathrm{W}\) and its altitude is \(100 \, \mathrm{m}\).
The MRRs are upward looking \(24 \, \mathrm{GHz}\) micro-rain radars which detect fall velocity and rain rate of hydrometeors.
All data have a temporal resolution of \(1 \, \mathrm{min}\), and the height ranges sampled are documented below. The MRRs resolve the height dimension with 31 distinct levels.
Data Availability#
Datasets are available in .zarr format in the catalog.
The three height range configurations for the MRR are as follows, and datasets are named according to these conventions:
1: [100, 3100]
2: [200, 6200]
3: [35, 1085]
Note
There are very few days with configuration 3, so we currently do not provide this data in the catalog, although the package is capable of reading data with this height range.
The table below summarizes the available MRR Level 1 datasets:
Site |
Key |
Start |
Stop |
Range |
|---|---|---|---|---|
BCO |
|
2015-01-16 |
present |
[100, 3100] |
CIMH |
|
2009-12-19 |
2025-06-29 |
[100, 3100] |
EMBRAPA |
|
2012-06-08 |
2016-02-29 |
[200, 6400] |
Sample Plots#
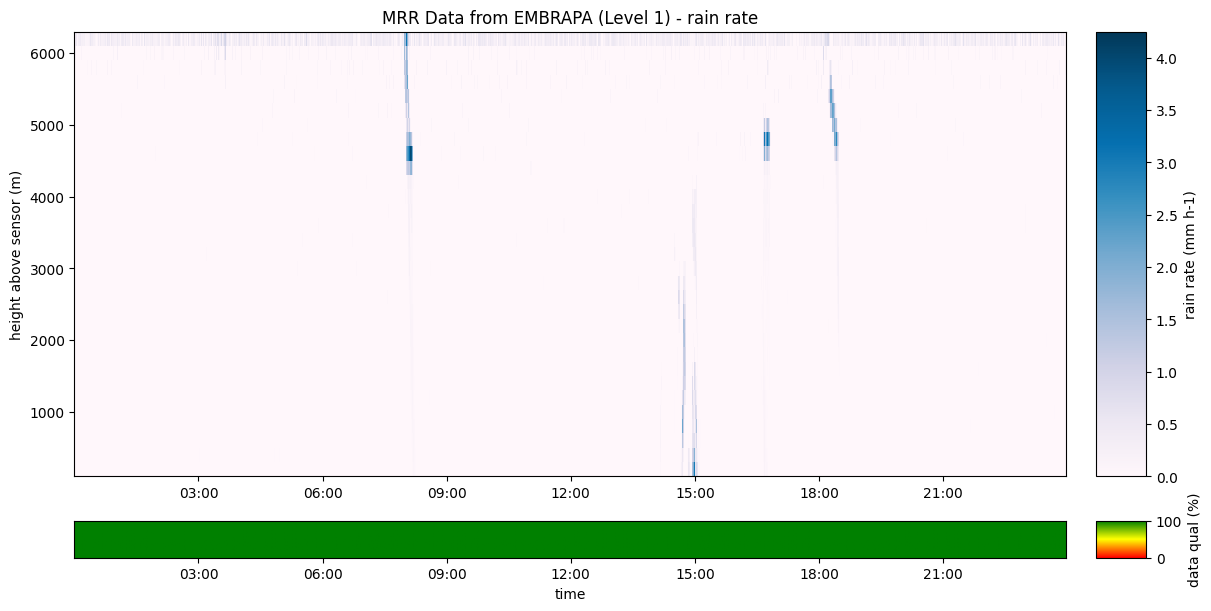
Here we plot rain rate alongside MDQ (data quality of spectra in percent of spectra per time) for a single day during the campaign.
# open catalog
cat = intake.open_catalog("https://tcodata.mpimet.mpg.de/catalog.yaml")

# select dataset
mrr = cat.EMBRAPA.mrr_c2(version=1).to_dask()

embrapa = slice(np.datetime64("2015-04-16"), np.datetime64("2015-04-17"))
plot_rr_with_mdq(mrr.sel(time=embrapa))
/builds/tco/bco/docs/.venv/lib/python3.12/site-packages/intake_xarray/base.py:21: FutureWarning: The return type of `Dataset.dims` will be changed to return a set of dimension names in future, in order to be more consistent with `DataArray.dims`. To access a mapping from dimension names to lengths, please use `Dataset.sizes`.
  'dims': dict(self._ds.dims),
# full dataset
mrr
<xarray.Dataset> Size: 38GB
Dimensions:  (time: 1522950, range: 31, bin: 64)
Coordinates:
    alt      int64 8B ...
  * bin      (bin) int64 512B 0 1 2 3 4 5 6 7 8 9 ... 55 56 57 58 59 60 61 62 63
    lat      float64 8B ...
    lon      float64 8B ...
  * range    (range) float32 124B 200.0 400.0 600.0 ... 5.8e+03 6e+03 6.2e+03
  * time     (time) datetime64[ns] 12MB 2012-06-08T05:23:00 ... 2016-02-29T23...
Data variables: (12/15)
    CC       (time) int64 12MB dask.array<chunksize=(262144,), meta=np.ndarray>
    D        (time, range, bin) float32 12GB dask.array<chunksize=(256, 31, 32), meta=np.ndarray>
    DSN      (time) uint16 3MB dask.array<chunksize=(262144,), meta=np.ndarray>
    DVS      (time) uint16 3MB dask.array<chunksize=(262144,), meta=np.ndarray>
    F        (time, range, bin) float32 12GB dask.array<chunksize=(256, 31, 32), meta=np.ndarray>
    LWC      (time, range) float32 189MB dask.array<chunksize=(8192, 31), meta=np.ndarray>
    ...       ...
    RR       (time, range) float32 189MB dask.array<chunksize=(8192, 31), meta=np.ndarray>
    SVS      (time) uint16 3MB dask.array<chunksize=(262144,), meta=np.ndarray>
    TF       (time, range) float32 189MB dask.array<chunksize=(8192, 31), meta=np.ndarray>
    W        (time, range) float32 189MB dask.array<chunksize=(8192, 31), meta=np.ndarray>
    Z        (time, range) float32 189MB dask.array<chunksize=(8192, 31), meta=np.ndarray>
    Za       (time, range) float32 189MB dask.array<chunksize=(8192, 31), meta=np.ndarray>
Attributes:
    Conventions:      CF-1.12
    bcoproc_version:  0.0.0.post920.dev0+674091c
    featureType:      timeSeriesProfile
    institution:      Max Planck Institute for Meteorology, Hamburg
    license:          CC0-1.0
    location:         The Barbados Cloud Observatory (BCO), Deebles Point, Ba...
    platform:         BCO
    source:           METEK MRR-2
    title:            MRR Data from EMBRAPA (Level 1)
    tool_versions:    {"Python": "3.11.2 (main, Apr 28 2025, 14:11:48) [GCC 1...