Rain gauge (WAD)#
Here be Dragons!
Compared to other precipitation measurements, the data from the rain gauge shows significant discrepancies.
After initial investigations we estimate the bucket was reliable for about 3 months after its installation, after which the data became not suitable for scientific use, up until it was removed on 2025-09-25. It was reinstalled 2026-01-29 and is currently in operation. The data taken since then should be reevaluated for scientific usability.
When investigating the bucket’s data, please also note that on September 1 2025 at 16:23, \(100 \, \mathrm{ml}\) of water was poured into the bucket as a test for instrument functionality.
Instrumentation#
Since 2023-05-09, the BCO has operated a WAD200 rain measurement system at the site.
The instrument collects falling hydrometeors in a \(200 \mathrm{cm}^2\) aperture and funnels to a vessel (“bucket”) which is self-emptying and calibrated yearly. The data output includes rain intensity (\(\mathrm{mm} \mathrm{h}^{-1}\)) and total collected rain (\(\mathrm{mm}\)) as well as temperature and system status.
Data Availability#
The data is available in .zarr format as BCO.bucket_WAD_c1_v1 in the catalog.
Sample Plot#
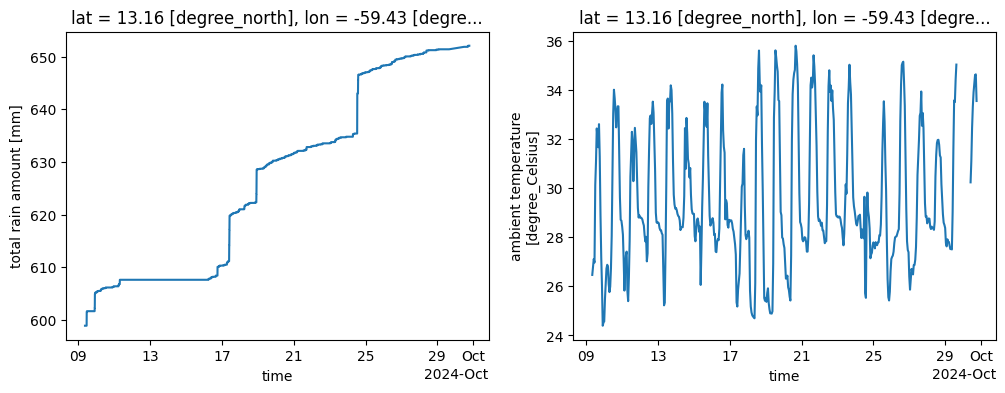
Let’s plot cumulative rain and hourly average temperature for a few weeks in September 2024, the period of the ORCESTRA Campaign.
import intake
import matplotlib.pylab as plt

cat = intake.open_catalog("https://tcodata.mpimet.mpg.de/catalog.yaml")
ds_bucket = cat.BCO.bucket_WAD_c1_v1.to_dask()

# period of ORCESTRA
orcestra = slice("2024-09-09", "2024-09-30")

subset = ds_bucket.sel(time=orcestra)

fig, (ax1, ax2) = plt.subplots(1, 2, figsize=(12, 4))
subset.R.plot(ax=ax1)
subset.T.compute().resample(time="1h").mean().plot(ax=ax2)
/builds/tco/bco/docs/.venv/lib/python3.12/site-packages/intake_xarray/base.py:21: FutureWarning: The return type of `Dataset.dims` will be changed to return a set of dimension names in future, in order to be more consistent with `DataArray.dims`. To access a mapping from dimension names to lengths, please use `Dataset.sizes`.
  'dims': dict(self._ds.dims),
[<matplotlib.lines.Line2D at 0x7f6c86c2c1a0>]
The full dataset:
ds_bucket
<xarray.Dataset> Size: 164MB
Dimensions:  (time: 7825415)
Coordinates:
    lat      float64 8B ...
    lon      float64 8B ...
  * time     (time) datetime64[ns] 63MB 2023-05-09T19:22:47 ... 2026-04-27T23...
Data variables:
    R        (time) float32 31MB dask.array<chunksize=(262144,), meta=np.ndarray>
    RIH      (time) float32 31MB dask.array<chunksize=(262144,), meta=np.ndarray>
    SYS      (time) int8 8MB dask.array<chunksize=(262144,), meta=np.ndarray>
    T        (time) float32 31MB dask.array<chunksize=(262144,), meta=np.ndarray>
    alt      float64 8B ...
Attributes:
    Conventions:           CF-1.12
    _logical_cutoff_date:  2026-04-28T00:00:00Z
    bcoproc_version:       0.0.0.post1287.dev0+e1e8fbd
    featureType:           timeSeries
    institution:           Max Planck Institute for Meteorology, Hamburg
    license:               CC0-1.0
    location:              The Barbados Cloud Observatory (BCO), Deebles Poin...
    platform:              BCO
    source:                OTT WAD 200
    summary:               This dataset contains precipitation measurements f...
    title:                 Raingauge measurements from BCO (Level 1)
    tool_versions:         {"Python": "3.11.2 (main, Apr 28 2025, 14:11:48) [...