Cloud Radars#
Cloud radars use electromagnetic radiation approximately in the range of 30 to 200 GHz in bands which are sensitive to cloud droplets and ice crystals. As the wavelength is typically larger than the size of the observed particles, the signal is mainly governed by Rayleigh scattering, and thus, the signal is more sensitive to the size of the observed particles than their amount. Although clouds attenuate the radiation, cloud radars can typically see through clouds and thus, can also provide information behind the first layer.
A radar from the Karlsruhe Institute of Technology (KIT) inaugurated the long lineage of BCO Ka-band radars in 2010, after which the KATRIN radar arrived in December of the same year, replacing the KIT radar soon after. In 2015, the MBR2 replaced the KATRIN radar, and it enjoyed a lengthy tenure before it was decomissioned in 2024. As it was phased out, the MBRS radar began operations, and this radar is still in operation.
At the end of 2018, a W Band radar (called RUMBA) was installed and has since been in operation intermittently with a large hiatus from September 2024 to January 2026.
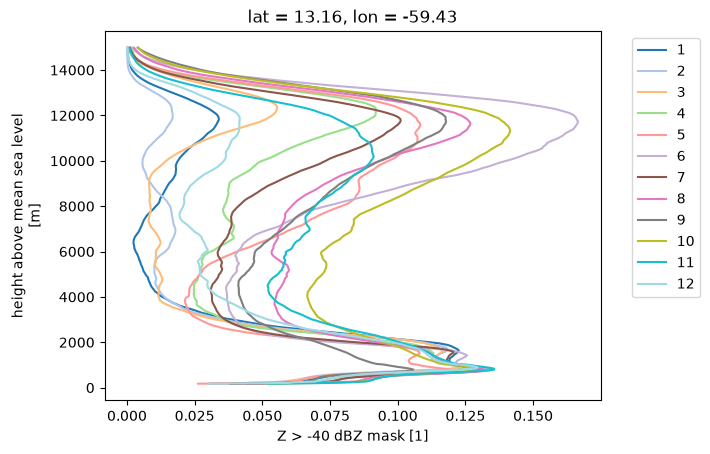
A level 2 product on the vertical axis of the MBRS and of the fourth configuration of MBR2 can be accessed as shown below. The dataset contains rabbit-ear filtered reflectivities and selected level 1 variables, with an added cloud_fraction defined as reflectivities greater than -40 dBZ. We drop low transmission power, and we set reflectivities with signals below the instrument’s sensitivity threshold to -inf, whereas we set reflectivities above the instrument’s sensitivity threshold to +inf. The dataset is available at a range of time resolutions.
import intake
cat = intake.open_catalog("https://tcodata.mpimet.mpg.de/catalog.yaml")
ds = cat.BCO.cloudradar(time="PT1H").to_dask()
ds
/builds/tco/bco/docs/.venv/lib/python3.14/site-packages/intake_xarray/base.py:21: FutureWarning: The return type of `Dataset.dims` will be changed to return a set of dimension names in future, in order to be more consistent with `DataArray.dims`. To access a mapping from dimension names to lengths, please use `Dataset.sizes`.
  'dims': dict(self._ds.dims),
<xarray.Dataset> Size: 7GB
Dimensions:         (time: 138630, alt: 605, bnd: 2)
Coordinates:
  * time            (time) datetime64[ns] 1MB 2010-12-22T19:30:00 ... 2026-10...
  * alt             (alt) float64 5kB 174.4 205.6 236.8 ... 1.898e+04 1.901e+04
    lat             float64 8B ...
    lon             float64 8B ...
Dimensions without coordinates: bnd
Data variables: (12/13)
    DPS             (time, alt) float64 671MB dask.array<chunksize=(131072, 32), meta=np.ndarray>
    DPSwav          (time, alt) float64 671MB dask.array<chunksize=(131072, 32), meta=np.ndarray>
    LDR             (time, alt) float64 671MB dask.array<chunksize=(131072, 32), meta=np.ndarray>
    MeltHei         (time) float32 555kB dask.array<chunksize=(138630,), meta=np.ndarray>
    NPK             (time, alt) float64 671MB dask.array<chunksize=(131072, 32), meta=np.ndarray>
    RHO             (time, alt) float64 671MB dask.array<chunksize=(131072, 32), meta=np.ndarray>
    ...              ...
    SNR             (time, alt) float64 671MB dask.array<chunksize=(131072, 32), meta=np.ndarray>
    VEL             (time, alt) float64 671MB dask.array<chunksize=(131072, 32), meta=np.ndarray>
    Z               (time, alt) float64 671MB dask.array<chunksize=(131072, 32), meta=np.ndarray>
    cloud_fraction  (time, alt) float64 671MB dask.array<chunksize=(131072, 32), meta=np.ndarray>
    raw_count       (time) float64 1MB dask.array<chunksize=(138630,), meta=np.ndarray>
    time_bounds     (time, bnd) datetime64[ns] 2MB dask.array<chunksize=(138630, 2), meta=np.ndarray>
Attributes:
    Conventions:           CF-1.12
    _cutoff_date:          2026-10-16T00:00:04.000001000
    _logical_cutoff_date:  2014-11-01T00:00:00Z
    bcoproc_version:       0.0.0.post2354.dev0+f9b7f57e
    featureType:           timeSeriesProfile
    institution:           Max Planck Institute for Meteorology, Hamburg
    license:               CC-BY-4.0
    location:              The Barbados Cloud Observatory (BCO), Deebles Poin...
    platform:              BCO
    source:                https://swift.dkrz.de/v1/dkrz_948e7d4bbfbb445fbff5...
    title:                 Ka-band cloud radar data (level 2, rabbit-ear filt...
tool_versions: {"Python": "3.14.3 (main, Mar 3 2026, 14:59:53) [...monthly cloud fraction profiles#
for m in months:
    ds.sel(time=ds.time.dt.month.isin([m]), alt=slice(None, 15000)).cloud_fraction.mean(dim="time").plot(y="alt", label=m, color=colors[m-1])
plt.legend(bbox_to_anchor=(1.05, 1), loc='upper left')
<matplotlib.legend.Legend at 0x7fec5801e270>