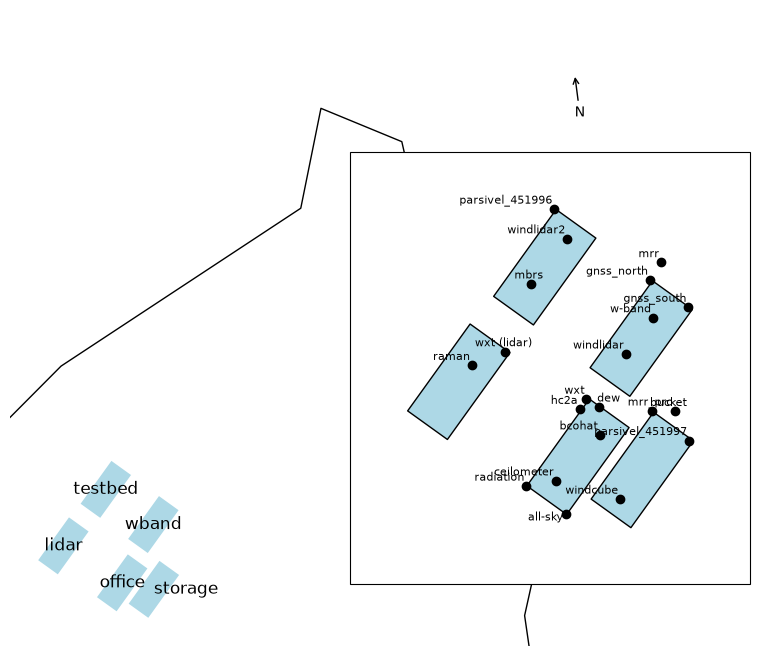
Site schematic#
Below, you can find a sketch of the named shipping containers housing the instruments at the BCO.
Show code cell source
Hide code cell source
import geopandas as gpd
import matplotlib.pyplot as plt
import cartopy.crs as ccrs
import json
from shapely.ops import transform
objs = json.load(open("bco_geo.json"))
gdf = gpd.GeoDataFrame.from_features(objs).set_index("name")
gdf.crs = "EPSG:4326"
containers = gdf.loc[[x.name for _, x in gdf.iterrows() if x.type == "container"]]
instruments = gdf.loc[[x.name for _, x in gdf.iterrows() if x.type == "instrument"]]
coastline = gpd.GeoDataFrame.from_features([obj for obj in objs["features"] if obj["properties"].get("name") == "coast"]).geometry
xmin, ymin, xmax, ymax = containers.total_bounds
width = xmax - xmin
height = ymax - ymin
buffer = width * 0.2

def plot_instruments(fig, ax, arrow=False):
    for __, row2 in containers.iterrows():
        geom2 = row2.geometry
        name2 = row2.name

        ax.add_geometries(
            [geom2],
            ccrs.PlateCarree(),
            facecolor="lightblue",
            edgecolor="black",
            linewidth=1,
        )

        centroid2 = geom2.centroid

    for ___, row3 in instruments.iterrows():
        geom3 = row3.geometry
        name3 = row3.name
        ax.plot(
            geom3.x,
            geom3.y,
            marker="o",
            markersize=6,
            color="black",
            markeredgecolor="black",
            transform=ccrs.PlateCarree(),
            zorder=10,
        )
        ax.text(
            geom3.x-0.007*width,
            geom3.y+0.009*width,
            name3,
            ha=row3.fillna('right').label_ha,
            va=row3.fillna('bottom').label_va,
            fontsize=8,
            color="black",
            transform=ccrs.PlateCarree(),
        )

    ax.set_extent(
        [
            xmin-buffer,
            xmax+buffer,
            ymin-buffer,
            ymax+buffer,
        ],
        crs=ccrs.PlateCarree(),
    )

    ax.add_geometries(
        coastline,
        ccrs.PlateCarree(),
        edgecolor="black",
        facecolor="#FFFFFF00",
    )

    if arrow:
        arrow_x, arrow_y = xmax - 0.1*width, ymax - 0.1*width

        ax.annotate(
            "N",
            xy=(arrow_x, arrow_y + 0.05*width),
            xytext=(arrow_x, arrow_y),
            arrowprops=dict(arrowstyle="->", lw=1, color="black"),
            ha="center",
            transform=ccrs.PlateCarree(),
        )

fig, ax = plt.subplots(
    figsize=(8, 8 * height/width),
    subplot_kw={'projection': ccrs.PlateCarree()}
)


for _, row in containers.iterrows():
    geom = row.geometry
    name = row.name
    ax.add_geometries([geom], ccrs.PlateCarree(),
                     facecolor='lightblue',
                     linewidth=1)
    centroid = geom.centroid
    ax.text(centroid.x, centroid.y, name,
           ha=row.fillna("center").label_ha, va='center',
           fontsize=12, color='black')
ax.set_extent([xmin - buffer, xmax + buffer + 3*width, ymin - buffer, ymax + buffer + 3*width], crs=ccrs.PlateCarree())
ax.add_geometries(coastline, ccrs.PlateCarree(), edgecolor='black', facecolor="#FFFFFF00")
arrowx, arrowy = [
      -59.42823,
      13.1630935
    ]
ax.annotate('N', xy=(arrowx, arrowy+0.3*(width)), xytext=(arrowx, arrowy),
           arrowprops=dict(arrowstyle='->', lw=1, color='black'), transform=ccrs.PlateCarree())
ax.axis('off')
ax_inset = fig.add_axes(
    [0.55, 0.2, 0.5, 0.5],
    projection=ccrs.PlateCarree(),
)
plot_instruments(fig, ax_inset)
ax_inset.set_xticks([])
ax_inset.set_yticks([])
plt.show()