Doppler Wind Lidars#
There are two Doppler wind lidars at the Barbados Cloud Observatory (BCO) – both HALO Photonics (formerly; now Lumi Bird) Stream Line Pro Scanning Doppler Lidars.
Both instruments use a laser beam with a wavelength of 1550 nm to measure line-of-sight component of wind velocity in the atmospheric boundary layer. Two modes of operation are possible - staring at the zenith and scanning in several vertically inclined directions. These two modes may be distinguished by the zenith angle of the measurement.
Nomenclature of instruments#
Both Doppler wind lidars at BCO are the same instruments in terms of their specifications (both are commercially produced models of the same kind). Therefore we will simply distinguish them by their order of arrival at BCO.
WindLidar1 -> Chronologically first at BCO
WindLidar2 -> Chronologically second at BCO
Configurations#
Wind lidars have been operated in different configurations over time. These configurations can be distinguished by the number of averaging gates along the laser beam and their length. The different available configurations are listed here:
Dataset |
Gates number |
Gate length |
Start date |
End date |
|---|---|---|---|---|
|
100 |
30.0 m |
2015-07-26 |
2015-09-17 |
|
1000 |
30.0 m |
2019-08-27 |
2019-09-01 |
|
100 |
60.0 m |
2015-09-17 |
2015-09-18 |
|
100 |
30.0 m |
2019-02-18 |
2021-04-11 |
|
160 |
60.0 m |
2021-04-11 |
2021-05-21 |
Deployments#
During the operation at BCO wind lidars were deployed on two containers. The locations of instruments at different periods of time are listed here:
Instrument |
Location (container) |
Mode |
Start date |
End date |
|---|---|---|---|---|
WindLidar1 |
Testbed |
Scan |
2015-07-26 |
2016-02-29 |
WindLidar1 |
Testbed |
Stare |
2016-03-02 |
2019-10-31 |
WindLidar1 |
WBand |
Stare |
2021-07-21 |
2024-09-20 |
WindLidar1 |
WBand |
Stare |
2025-09-23 |
today |
WindLidar2 |
WBand |
Stare |
2019-02-18 |
2019-03-05 |
WindLidar2 |
WBand |
Scan |
2019-03-06 |
2021-07-21 |
WindLidar2 |
WBand |
Stare |
2024-09-20 |
2025-09-10 |
Notes on the Deployments table#
Modes:
Stare mode: provides only vertical winds
Scan mode: provides both horizontal and vertical winds
Testbed and WBand containers are roughly 5 m apart and have the same height.
The temporal resolution of the vertical wind speed is 1.3 s (information obtained from Wiki as on 30.07.2025).
We decided that the change of location (between two containers 5 m apart) does not warrant the dataset to be provided as being measurements from two deployments, therefore WindLidar1’s Stare mode data from both Testbed and WBand containers are provided in the same dataset.
Example#
Get wind lidar dataset from tcodata:
import intake


cat = intake.open_catalog("https://tcodata.mpimet.mpg.de/catalog.yaml")
wl1 = cat.BCO.windlidar1_c1_v1(chunks=None).to_dask()
wl1
/builds/tco/bco/docs/.venv/lib/python3.12/site-packages/intake_xarray/base.py:21: FutureWarning: The return type of `Dataset.dims` will be changed to return a set of dimension names in future, in order to be more consistent with `DataArray.dims`. To access a mapping from dimension names to lengths, please use `Dataset.sizes`.
  'dims': dict(self._ds.dims),
<xarray.Dataset> Size: 325GB
Dimensions:              (time: 132128643, range: 100)
Coordinates:
    alt                  int64 8B ...
    lat                  float64 8B ...
    lon                  float64 8B ...
  * range                (range) float64 800B 15.0 45.0 ... 2.955e+03 2.985e+03
    sensor_alt           int64 8B ...
  * time                 (time) datetime64[ns] 1GB 2015-07-26T21:11:44.379600...
Data variables: (12/13)
    azi                  (time) float64 1GB ...
    beta                 (time, range) float64 106GB ...
    doppler              (time, range) float64 106GB ...
    focus                (time) int64 1GB ...
    gate_length          float64 8B ...
    gates_number         int64 8B ...
    ...                   ...
    pitch                (time) float64 1GB ...
    pulses               (time) int64 1GB ...
    resolution           float64 8B ...
    roll                 (time) float64 1GB ...
    timejump_correction  (time) bool 132MB ...
    zenith               (time) float64 1GB ...
Attributes: (12/13)
    Conventions:           CF-1.12
    _logical_cutoff_date:  2023-06-26T00:00:00Z
    bcoproc_version:       0.0.0.post1185.dev0+c830e01
    featureType:           timeSeriesProfile
    history:               processed with bcoproc l1
    institution:           Max Planck Institute for Meteorology, Hamburg
    ...                    ...
    location:              The Barbados Cloud Observatory (BCO), Deebles Poin...
    platform:              BCO
    source:                Halo Photonics Stream Line Pro Scanning Doppler Lidar
    summary:               The Halo Photonics Stream Line Pro Scanning Dopple...
    title:                 WindLidar data from BCO (Level 1)
tool_versions: {"Python": "3.11.2 (main, Apr 28 2025, 14:11:48) [...def is_vertical(ds):
return ds["zenith"] < 2
def is_reliable(ds):
# mask signals from the point where it became too much attenuated
return (ds["intensity"] <= 1.015).cumsum("range") < 1
# cut, filter, resample and plot the data
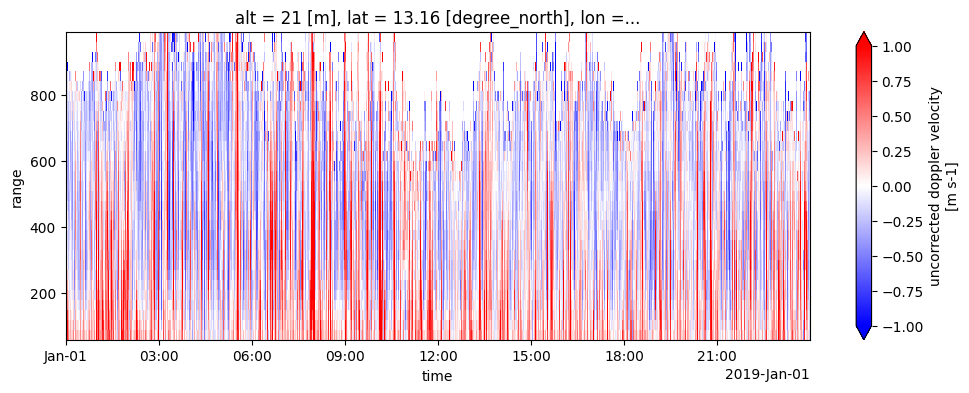
wl1_day = wl1.sel(time="2019-01-01", range=slice(70, 1000))
wl1_1min_avg = wl1_day["doppler"].where(is_vertical(wl1_day) & is_reliable(wl1_day)).resample(time="1min").mean()
wl1_1min_avg.plot(x="time", y="range", vmin=-1, vmax=1, figsize=(12, 4), cmap="bwr")
<matplotlib.collections.QuadMesh at 0x7fb188724320>
Note
The intensity threshold follows Päschke et al. [2015].