TCO data#
This website serves as a starting point for accessing data from the Tropical Cloud Observations Group at the Max-Planck-Institut für Meteorologie in Hamburg. At this place, we cover data from our permanent observation site, the Barbados Cloud Observatory (BCO), as well as data acquired during various field campaigns.
using the data#
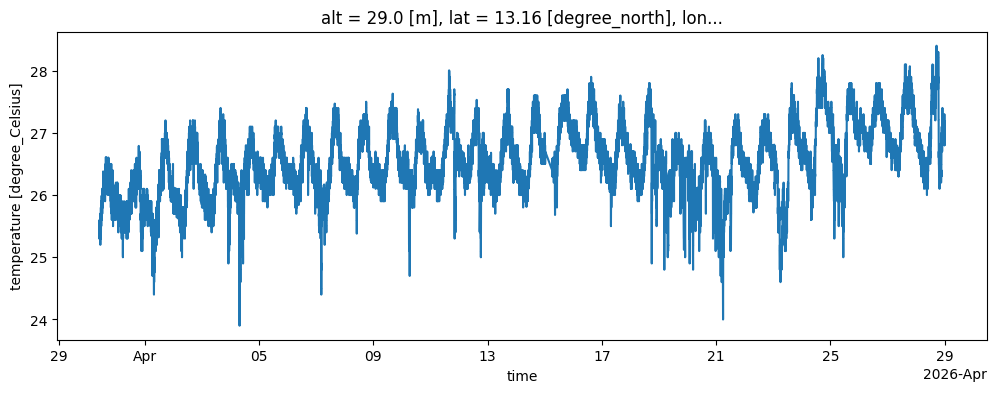
We generally make data available through an intake catalog, in a way which enables anyone to open our datasets directly (i.e. without prior subsetting and downloading). To get a quick glimpse of how this may look like, here’s a Python example showing the surface temperature at the BCO over the last 30 days:
from datetime import datetime, timedelta
import intake

cat = intake.open_catalog("https://tcodata.mpimet.mpg.de/catalog.yaml")
wxt = cat.BCO.surfacemet_wxt_v1.to_dask()
wxt["T"].sel(time=slice(datetime.now() - timedelta(days=30), datetime.now())).plot(figsize=(12, 4));
So in general, the steps to access the data are:
open the tcodata catalog
select and get a dataset
do something with the dataset
Please have a look at the description of the individual instruments and datasets to find out which data is available in our catalog.
requirements#
For the code to actually work on your machine, a few Python packages are required, which you could install e.g. using pip:
python -m pip install 'intake<2' requests aiohttp intake-xarray
This should be enough to access our datasets, but you might of course want to use further packages for data processing and presentation.
In this documentation, we use e.g. matplotlib to create example plots.
Full requirements for tcodata documentation.
For reference, here’s the complete list of requirements to build the entire tcodata documentation including data access and plots:
[project]
name = "tcodata_docs"
version = "0.1.0"
description = "TCO data documentation"
readme = "intro.md"
requires-python = ">=3.11"
dependencies = [
    "aiohttp>=3.11.18",
    "cf-xarray>=0.10.6",
    "fsspec>=2025.3.2",
    "intake<2",
    "intake-xarray<2",
    "jupyter-book<2",
    "jupyter-cache>=1.0.1",
    "matplotlib>=3.10.3",
    "numpy>=2.2.5",
    "pint>=0.24.4",
    "pint-xarray>=0.5.0",
    "requests>=2.32.4",
    "xarray>=2025.4.0",
    "zarr>=2.18.7",
    "pandas>=2.2.3",
    "pvlib>=0.10.5"
]